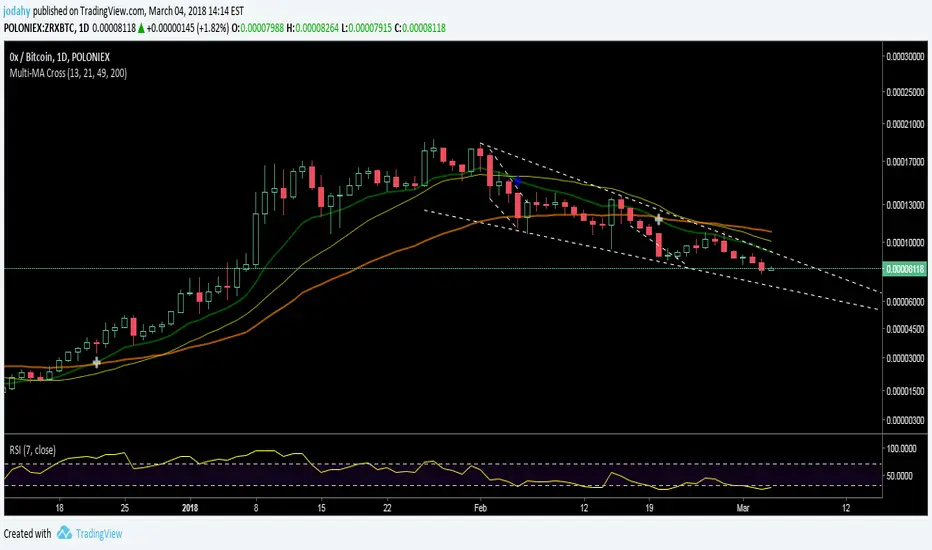
Multi-MA CrossingDesigned/back-tested for daily BTC/USD closing price.
Your mileage may vary for other assets/time frames.
By default includes 13 EMA, 21 SMA, 49 EMA, 200 EMA.
Crosses of 13 / 49 EMA are for buy/sell signals.
13 EMA / 21 SMA cross-unders are for sell signals near local tops.
EMA periods are editable.
See text in the Pine Editor for additional notes on the indicators.
Combine with oscillators for more rapid identification of reversals.
Good luck! -JDH
在腳本中搜尋"MA Cross"
Price Volume Rank [LazyBear]Price-Volume Rank, designed by Anthony J. Macek, compares the direction of the change in price (up or down) to the direction of the change in volume and assigns a number to that specific relationship. By quantifying price/volume interaction, P-V rank seeks to determine our position within a typical market cycle.
The various modes shown on the chart above or explained below. Also, read on for a little trick using the new Pine feature that you can use in your script.
How to read the PVR?
-------------------
The most desirable market condition occurs when both price and volume are moving up, that phenomenon is assigned a PVR of 1.
The next most desirable condition, when prices are still moving up but volume is diminishing, is given a PVR of 2. Although still technically healthy, this relationship between price and volume issues a warning that market momentum is weakening.
The worst-case scenario, seen when selling pressure is greatest with prices dropping and volume
increasing, is given PVR's weakest designation, 4.
Finally, even though prices are still moving down, volume begins to diminish as selling pressure abates. This price/volume relationship is assigned a PVR of 3, often alerting us to a potential buying opportunity ahead.
What do the modes mean?
----------------------
1) Histogram Mode: This plots PVR along with helpful ranges. Be careful when PVR is trending at turn-around points.
2) MA Crossover Mode: This plots a slow/fast MA of PVR. Default is 5/10 SMA. Buy is signalled when slow MA falls below fast MA. Sell is signalled when slow MA crosses up fast MA. There is a warning line at 2.5 that can be used for more confirmation.
3) Double Smoothed Crossover Mode: Same as MA crossover, but PVR is smoothed more. Warning line (2.5 level) is very useful in this mode. Use slow MA as the signal and fast MA of PVR for tracking the market.
Misc notes:
-----------
This won't work for Forex and other instruments for which TradingView doesn't expose volume. Thanks to the new Text rendering feature of PlotShape(), I can actually let users know of that :) Good use-case, eh? I will post a sample chart below in the comments.
Feel free to use any part of this code in your indicators.
More info:
--------
Stocks & Commodities V. 12:6 (235-239): Price-Volume Rank by Anthony J. Macek
Complete list of my indicators:
-----------------------------
docs.google.com

Multi-Condition Alert Builder⚡ Multi-Condition Alert Builder — Modular Alert Framework
The Multi-Condition Alert Builder is a powerful, code-free alert engine for TradingView. It allows traders to build complex multi-condition Buy/Sell alerts using simple dropdown menus — no Pine Script experience required.
Combine up to five separate conditions per side and trigger alerts based on your own custom logic.
🧠 How It Works
Each “Buy” and “Sell” side includes up to five configurable slots, where you can define:
Two data sources (indicators, price, or custom inputs)
A comparison or crossover condition
A static value (optional)
Once your slots are defined, the script combines these individual conditions according to your chosen mode:
Any – triggers when any enabled condition is true
All – same bar – triggers only when all enabled conditions occur on the same bar
All – within bars – allows conditions to complete within a user-defined lookback window
This gives traders fine-grained control to design powerful, adaptive alert logic directly in the chart — no coding required.
⚙️ Key Features
🧩 Up to 5 Buy and 5 Sell Slots – Fully customizable condition slots
🧠 Combine Logic Modes – Any / All / Within Bars flexibility
🔔 Custom Alerts – Generates separate Buy, Sell, or combined alert events
⏱️ Close-Bar Confirmation Option – Avoids premature signals on open candles
💡 Visual Signals – Plots arrows on chart for clear alert visualization
🔄 Indicator-Agnostic – Works with any sources or indicators available in your chart
🧮 Combine Logic Modes Explained
Mode Description
Any Triggers an alert if any active condition is met
All – same bar Requires all active slots to confirm on the same candle
All – within bars Conditions may complete within a set lookback window
🧭 Example Use Cases
Combine RSI, MACD, and MA crossovers for precision entries
Create alert triggers for momentum confluence setups
Build “stacked signal” logic (e.g., RSI < 30 and MACD crossover within 3 bars)
Quickly prototype and test multi-factor alert conditions
🧠 Usage Tip
Once your conditions are set, simply add TradingView alerts tied to:
“BUY↟” for long signals
“SELL↡” for short signals
“ANY ALERT” to trigger on either event
The Alert Builder becomes especially powerful when combined with your favorite custom indicators — enabling smart, automated alerts without extra coding.
⚡ In Short
Build. Combine. Alert.
The Multi-Condition Alert Builder gives you total flexibility to design complex alert logic — visually, intuitively, and efficiently — right on your chart.
Bull Market Support Band (20W SMA + 21W EMA)🟩 Bull Market Support Band (20W SMA + 21W EMA)
OVERVIEW
The Bull Market Support Band is a long-term trend indicator that combines the 20-week SMA and 21-week EMA.
When price is above the band → bullish trend.
When below → bearish trend.
When within → neutral or transition phase.
This v6 version adds full customization, dynamic coloring, event labels, candle coloring, and a configurable on-chart legend table with trend arrows.
HOW IT WORKS
Calculates the 20W SMA and 21W EMA from a user-selectable higher timeframe (weekly by default).
Plots both averages and shades the area between them to form the support band.
The fill and line colors change automatically based on the market phase:
🟩 Green = Bullish (price above)
🟥 Red = Bearish (price below)
⬜ Gray = Neutral (price within).
Labels appear only when the trend state changes.
Alerts trigger when price crosses the band or either moving average.
Optional candle coloring applies the same bull/bear/neutral logic to price bars.
A convenience legend table displays current 20W SMA and 21W EMA values, along with slope arrows (^, v, =).
INCLUDED FEATURES
Configurable calculation timeframe.
Automatic band fill and line coloring.
Optional candle coloring overlay.
Compact or detailed regime-change labels.
ATR-based label offset and spacing control.
Customizable legend table with background color.
Horizontal or vertical legend layout.
Custom arrow characters (ASCII or Unicode).
Built-in alerts for band and MA crosses.
Optimized for higher-timeframe accuracy using request.security().
USAGE TIPS
Keep the default weekly setting for macro trend context.
On lower chart timeframes, use the band as higher-level support/resistance.
Combine with momentum or volume indicators (RSI, MACD, OBV) for confirmation.
Adjust ATR multiplier to move labels further from price candles.
Increase “Min bars between labels” to reduce visual clutter.
Disable auto-coloring if you prefer a static color theme.
Toggle compact legend or switch between horizontal/vertical layouts for best fit.
INTERPRETATION GUIDE
🟩 Bullish: Price above the band → trend continuation likely.
⬜ Neutral: Price within the band → consolidation or potential reversal zone.
🟥 Bearish: Price below the band → downtrend continuation or distribution.
Sustained closes above or below the band typically align with major market cycle shifts.
NOTES
Uses request.security() for higher-timeframe precision — accurate even on smaller charts.
The legend table is screen-anchored and remains fixed as you pan or zoom.
Plots and labels are price-anchored and move with candles.
Lightweight and efficient for all markets and intervals.
CREDITS
Original concept: The Bull Market Support Band (popularized in crypto analysis).
Enhanced Pine Script v6 version: Ricco .
Modernized for clarity, flexibility, and multi-timeframe accuracy.
SUMMARY
A modern, customizable Bull Market Support Band indicator highlighting long-term market regimes with clean visuals, color logic, and convenience features.
Designed for traders seeking macro clarity, minimal clutter, and professional presentation.

TradeScope: MA Reversion • RVOL • Trendlines • GAPs • TableTradeScope is an all-in-one technical analysis suite that brings together price action, momentum, volume dynamics, and trend structure into one cohesive and fully customizable indicator.
An advanced, modular trading suite that combines moving averages, reversion signals, RSI/CCI momentum, relative volume, gap detection, trendline analysis, and dynamic tables — all within one powerful dashboard.
Perfect for swing traders, intraday traders, and analysts who want to read price strength, volume context, and market structure in real time.
⚙️ Core Components & Inputs
🧮 Moving Average Settings
Moving Average Type & Length:
Choose between SMA or EMA and set your preferred period for smoother or more reactive trend tracking.
Multi-MA Plotting:
Up to 8 customizable moving averages (each with independent type, color, and length).
Includes a “window filter” to show only the last X bars, reducing chart clutter.
MA Reversion Engine:
Detects when price has extended too far from its moving average.
Reversion Lookback: Number of bars analyzed to determine historical extremes.
Reversion Threshold: Sensitivity multiplier—lower = more frequent signals, higher = stricter triggers.
🔄 Trend Settings
Short-Term & Long-Term Trend Lookbacks:
Uses linear regression to detect the slope and direction of the short- and long-term trend.
Results are displayed in the live table with color-coded bias:
🟩 Bullish | 🟥 Bearish
📈 Momentum Indicators
RSI (Relative Strength Index):
Adjustable period; displays the current RSI value, overbought (>70) / oversold (<30) zones, and trending direction.
CCI (Commodity Channel Index):
Customizable length with color-coded bias:
🟩 Oversold (< -100), 🟥 Overbought (> 100).
Tooltip shows whether the CCI is trending up or down.
📊 Volume Analysis
Relative Volume (RVOL):
Estimates end-of-day projected volume using intraday progress and compares it against the 20-day average.
Displays whether today’s volume is expected to exceed yesterday’s, and highlights color by strength.
Volume Trend (Short & Long Lookbacks):
Visual cues for whether current volume is above or below short-term and long-term averages.
Estimated Full-Day Volume & Multiplier:
Converts raw volume into “X” multiples (e.g., 2.3X average) for quick interpretation.
🕳️ Gap Detection
Automatically identifies and plots bullish and bearish price gaps within a defined lookback period.
Gap Lookback: Defines how far back to search for gaps.
Gap Line Width / Visibility: Controls the thickness and display of gap lines on chart.
Displays the closest open gap in the live table, including its distance from current price (%).
🔍 ATR & Volatility
14-day ATR (% of price):
Automatically converts the Average True Range into a percent, providing quick volatility context:
🟩 Low (<3%) | 🟨 Moderate (3–5%) | 🟥 High (>5%)
💬 Candlestick Pattern Recognition
Auto-detects popular reversal and continuation patterns such as:
Bullish/Bearish Engulfing
Hammer / Hanging Man
Shooting Star / Inverted Hammer
Doji / Harami / Kicking / Marubozu / Morning Star
Each pattern is shown with contextual color coding in the table.
🧱 Pivot Points & Support/Resistance
Optional Pivot High / Pivot Low Labels
Adjustable left/right bar lengths for pivot detection
Theme-aware text and label color options
Automatically drawn diagonal trendlines for both support and resistance
Adjustable line style, color, and thickness
Detects and tracks touches for reliability
Includes breakout alerts (with optional volume confirmation)
🚨 Alerts
MA Cross Alerts:
Triggers when price crosses the fast or slow moving average within a tolerance band (default ±0.3%).
Diagonal Breakout Alerts:
Detects and alerts when price breaks diagonal trendlines.
Volume-Confirmed Alerts:
Filters breakouts where volume exceeds 1.5× the 20-bar average.
🧾 Live Market Table
A fully dynamic table displayed on-chart, customizable via input toggles:
Choose which rows to show (e.g., RSI, ATR, RVOL, Gaps, CCI, Trend, MA info, Diff, Low→Close%).
Choose table position (top-right, bottom-left, etc.) and text size.
Theme selection: Light or Dark
Conditional background colors for instant visual interpretation:
🟩 Bullish or Oversold
🟥 Bearish or Overbought
🟨 Neutral / Moderate
🎯 Practical Uses
✅ Identify confluence setups combining MA reversion, volume expansion, and RSI/CCI extremes.
✅ Track trend bias and gap proximity directly in your dashboard.
✅ Monitor relative volume behavior for intraday strength confirmation.
✅ Automate MA cross or breakout alerts to stay ahead of key price action.
🧠 Ideal For
Swing traders seeking confluence-based setups
Intraday traders monitoring multi-factor bias
Analysts looking for compact market health dashboards
💡 Summary
TradeScope is designed as a single-pane-of-glass market view — combining momentum, trend, volume, structure, and reversion into one clear visual system.
Fully customizable. Fully dynamic.
Use it to see what others miss — clarity, confluence, and confidence in every trade.

CNS - Multi-Timeframe Bollinger Band OscillatorMy hope is to optimize the settings for this indicator and reintroduce it as a "strategy" with suggested position entry and exit points shown in the price pane.
I’ve been having good results setting the “Bollinger Band MA Length” in the Input tab to between 5 and 10. You can use the standard 20 period, but your results will not be as granular.
This indicator has proven very good at finding local tops and bottoms by combining data from multiple timeframes. Use BB timeframes that are lower than the timeframe you are viewing in your price pane.
The default settings work best on the weekly timeframe, but can be adjusted for most timeframes including intraday.
Be cognizant that the indicator, like other oscillators, does occasionally produce divergences at tops and bottoms.
Any feedback is appreciated.
Overview
This indicator is an oscillator that measures the normalized position of the price relative to Bollinger Bands across multiple timeframes. It takes the price's position within the Bollinger Bands (calculated on different timeframes) and averages those positions to create a single value that oscillates between 0 and 1. This value is then plotted as the oscillator, with reference lines and colored regions to help interpret the price's relative strength or weakness.
How It Works
Bollinger Band Calculation:
The indicator uses a custom function f_getBBPosition() to calculate the position of the price within Bollinger Bands for a given timeframe.
Price Position Normalization:
For each timeframe, the function normalizes the price's position between the upper and lower Bollinger Bands.
It calculates three positions based on the high, low, and close prices of the requested timeframe:
pos_high = (High - Lower Band) / (Upper Band - Lower Band)
pos_low = (Low - Lower Band) / (Upper Band - Lower Band)
pos_close = (Close - Lower Band) / (Upper Band - Lower Band)
If the upper band is not greater than the lower band or if the data is invalid (e.g., na), it defaults to 0.5 (the midline).
The average of these three positions (avg_pos) represents the normalized position for that timeframe, ranging from 0 (at the lower band) to 1 (at the upper band).
Multi-Timeframe Averaging:
The indicator fetches Bollinger Band data from four customizable timeframes (default: 30min, 60min, 240min, daily) using request.security() with lookahead=barmerge.lookahead_on to get the latest available data.
It calculates the normalized position (pos1, pos2, pos3, pos4) for each timeframe using f_getBBPosition().
These four positions are then averaged to produce the final avg_position:avg_position = (pos1 + pos2 + pos3 + pos4) / 4
This average is the oscillator value, which is plotted and typically oscillates between 0 and 1.
Moving Averages:
Two optional moving averages (MA1 and MA2) of the avg_position can be enabled, calculated using simple moving averages (ta.sma) with customizable lengths (default: 5 and 10).
These can be potentially used for MA crossover strategies.
What Is Being Averaged?
The oscillator (avg_position) is the average of the normalized price positions within the Bollinger Bands across the four selected timeframes. Specifically:It averages the avg_pos values (pos1, pos2, pos3, pos4) calculated for each timeframe.
Each avg_pos is itself an average of the normalized positions of the high, low, and close prices relative to the Bollinger Bands for that timeframe.
This multi-timeframe averaging smooths out short-term fluctuations and provides a broader perspective on the price's position within the volatility bands.
Interpretation
0.0 The price is at or below the lower Bollinger Band across all timeframes (indicating potential oversold conditions).
0.15: A customizable level (green band) which can be used for exiting short positions or entering long positions.
0.5: The midline, where the price is at the average of the Bollinger Bands (neutral zone).
0.85: A customizable level (orange band) which can be used for exiting long positions or entering short positions.
1.0: The price is at or above the upper Bollinger Band across all timeframes (indicating potential overbought conditions).
The colored regions and moving averages (if enabled) help identify trends or crossovers for trading signals.
Example
If the 30min timeframe shows the close at the upper band (position = 1.0), the 60min at the midline (position = 0.5), the 240min at the lower band (position = 0.0), and the daily at the upper band (position = 1.0), the avg_position would be:(1.0 + 0.5 + 0.0 + 1.0) / 4 = 0.625
This value (0.625) would plot in the orange region (between 0.85 and 0.5), suggesting the price is relatively strong but not at an extreme.
Notes
The use of lookahead=barmerge.lookahead_on ensures the indicator uses the latest available data, making it more real-time, though its effectiveness depends on the chart timeframe and TradingView's data feed.
The indicator’s sensitivity can be adjusted by changing bb_length ("Bollinger Band MA Length" in the Input tab), bb_mult ("Bollinger Band Standard Deviation," also in the Input tab), or the selected timeframes.

Multi-Timeframe Bollinger BandsMy hope is to optimize the settings for this indicator and reintroduce it as a "strategy" with suggested position entry and exit points shown in the price pane.
I’ve been having good results setting the “Bollinger Band MA Length” in the Input tab to between 5 and 10. You can use the standard 20 period, but your results will not be as granular.
This indicator has proven very good at finding local tops and bottoms by combining data from multiple timeframes. Use timeframes that are lower than the timeframe you are viewing in your price pane. Be cognizant that the indicator, like other oscillators, does occasionally produce divergences at tops and bottoms.
Any feedback is appreciated.
Overview
This indicator is an oscillator that measures the normalized position of the price relative to Bollinger Bands across multiple timeframes. It takes the price's position within the Bollinger Bands (calculated on different timeframes) and averages those positions to create a single value that oscillates between 0 and 1. This value is then plotted as the oscillator, with reference lines and colored regions to help interpret the price's relative strength or weakness.
How It Works
Bollinger Band Calculation:
The indicator uses a custom function f_getBBPosition() to calculate the position of the price within Bollinger Bands for a given timeframe.
Price Position Normalization:
For each timeframe, the function normalizes the price's position between the upper and lower Bollinger Bands.
It calculates three positions based on the high, low, and close prices of the requested timeframe:
pos_high = (High - Lower Band) / (Upper Band - Lower Band)
pos_low = (Low - Lower Band) / (Upper Band - Lower Band)
pos_close = (Close - Lower Band) / (Upper Band - Lower Band)
If the upper band is not greater than the lower band or if the data is invalid (e.g., na), it defaults to 0.5 (the midline).
The average of these three positions (avg_pos) represents the normalized position for that timeframe, ranging from 0 (at the lower band) to 1 (at the upper band).
Multi-Timeframe Averaging:
The indicator fetches Bollinger Band data from four customizable timeframes (default: 30min, 60min, 240min, daily) using request.security() with lookahead=barmerge.lookahead_on to get the latest available data.
It calculates the normalized position (pos1, pos2, pos3, pos4) for each timeframe using f_getBBPosition().
These four positions are then averaged to produce the final avg_position:avg_position = (pos1 + pos2 + pos3 + pos4) / 4
This average is the oscillator value, which is plotted and typically oscillates between 0 and 1.
Moving Averages:
Two optional moving averages (MA1 and MA2) of the avg_position can be enabled, calculated using simple moving averages (ta.sma) with customizable lengths (default: 5 and 10).
These can be potentially used for MA crossover strategies.
What Is Being Averaged?
The oscillator (avg_position) is the average of the normalized price positions within the Bollinger Bands across the four selected timeframes. Specifically:It averages the avg_pos values (pos1, pos2, pos3, pos4) calculated for each timeframe.
Each avg_pos is itself an average of the normalized positions of the high, low, and close prices relative to the Bollinger Bands for that timeframe.
This multi-timeframe averaging smooths out short-term fluctuations and provides a broader perspective on the price's position within the volatility bands.
Interpretation
0.0 The price is at or below the lower Bollinger Band across all timeframes (indicating potential oversold conditions).
0.15: A customizable level (green band) which can be used for exiting short positions or entering long positions.
0.5: The midline, where the price is at the average of the Bollinger Bands (neutral zone).
0.85: A customizable level (orange band) which can be used for exiting long positions or entering short positions.
1.0: The price is at or above the upper Bollinger Band across all timeframes (indicating potential overbought conditions).
The colored regions and moving averages (if enabled) help identify trends or crossovers for trading signals.
Example
If the 30min timeframe shows the close at the upper band (position = 1.0), the 60min at the midline (position = 0.5), the 240min at the lower band (position = 0.0), and the daily at the upper band (position = 1.0), the avg_position would be:(1.0 + 0.5 + 0.0 + 1.0) / 4 = 0.625
This value (0.625) would plot in the orange region (between 0.85 and 0.5), suggesting the price is relatively strong but not at an extreme.
Notes
The use of lookahead=barmerge.lookahead_on ensures the indicator uses the latest available data, making it more real-time, though its effectiveness depends on the chart timeframe and TradingView's data feed.
The indicator’s sensitivity can be adjusted by changing bb_length ("Bollinger Band MA Length" in the Input tab), bb_mult ("Bollinger Band Standard Deviation," also in the Input tab), or the selected timeframes.

Multi-Timeframe Bollinger Band PositionBeta version.
My hope is to optimize the settings for this indicator and reintroduce it as a "strategy" with suggested position entry and exit points shown in the price pane.
Any feedback is appreciated.
Overview
This indicator is an oscillator that measures the normalized position of the price relative to Bollinger Bands across multiple timeframes. It takes the price's position within the Bollinger Bands (calculated on different timeframes) and averages those positions to create a single value that oscillates between 0 and 1. This value is then plotted as the oscillator, with reference lines and colored regions to help interpret the price's relative strength or weakness.
How It Works
Bollinger Band Calculation:
The indicator uses a custom function f_getBBPosition() to calculate the position of the price within Bollinger Bands for a given timeframe.
Price Position Normalization:
For each timeframe, the function normalizes the price's position between the upper and lower Bollinger Bands.
It calculates three positions based on the high, low, and close prices of the requested timeframe:
pos_high = (High - Lower Band) / (Upper Band - Lower Band)
pos_low = (Low - Lower Band) / (Upper Band - Lower Band)
pos_close = (Close - Lower Band) / (Upper Band - Lower Band)
If the upper band is not greater than the lower band or if the data is invalid (e.g., na), it defaults to 0.5 (the midline).
The average of these three positions (avg_pos) represents the normalized position for that timeframe, ranging from 0 (at the lower band) to 1 (at the upper band).
Multi-Timeframe Averaging:
The indicator fetches Bollinger Band data from four customizable timeframes (default: 30min, 60min, 240min, daily) using request.security() with lookahead=barmerge.lookahead_on to get the latest available data.
It calculates the normalized position (pos1, pos2, pos3, pos4) for each timeframe using f_getBBPosition().
These four positions are then averaged to produce the final avg_position:avg_position = (pos1 + pos2 + pos3 + pos4) / 4
This average is the oscillator value, which is plotted and typically oscillates between 0 and 1.
Moving Averages:
Two optional moving averages (MA1 and MA2) of the avg_position can be enabled, calculated using simple moving averages (ta.sma) with customizable lengths (default: 5 and 10).
These can be potentially used for MA crossover strategies.
What Is Being Averaged?
The oscillator (avg_position) is the average of the normalized price positions within the Bollinger Bands across the four selected timeframes. Specifically:It averages the avg_pos values (pos1, pos2, pos3, pos4) calculated for each timeframe.
Each avg_pos is itself an average of the normalized positions of the high, low, and close prices relative to the Bollinger Bands for that timeframe.
This multi-timeframe averaging smooths out short-term fluctuations and provides a broader perspective on the price's position within the volatility bands.
Interpretation:
0.0 The price is at or below the lower Bollinger Band across all timeframes (indicating potential oversold conditions).
0.15: A customizable level (green band) which can be used for exiting short positions or entering long positions.
0.5: The midline, where the price is at the average of the Bollinger Bands (neutral zone).
0.85: A customizable level (orange band) which can be used for exiting long positions or entering short positions.
1.0: The price is at or above the upper Bollinger Band across all timeframes (indicating potential overbought conditions).
The colored regions and moving averages (if enabled) help identify trends or crossovers for trading signals.
Example:
If the 30min timeframe shows the close at the upper band (position = 1.0), the 60min at the midline (position = 0.5), the 240min at the lower band (position = 0.0), and the daily at the upper band (position = 1.0), the avg_position would be:(1.0 + 0.5 + 0.0 + 1.0) / 4 = 0.625
This value (0.625) would plot in the orange region (between 0.85 and 0.5), suggesting the price is relatively strong but not at an extreme.
Notes:
The use of lookahead=barmerge.lookahead_on ensures the indicator uses the latest available data, making it more real-time, though its effectiveness depends on the chart timeframe and TradingView's data feed.
The indicator’s sensitivity can be adjusted by changing bb_length ("Bollinger Band MA Length" in the Input tab), bb_mult ("Bollinger Band Standard Deviation," also in the Input tab), or the selected timeframes.

Razor Precision — Buy/SellRazor Precision Stock Action Indicator
The Razor Precision indicator is an advanced, multi-layered market analysis tool designed for traders who demand accuracy and alignment across multiple timeframes. It combines price action, moving average crossovers, volume confirmation, swing structure mapping, and indicator confluence (RSI, MACD, ATR, OBV) to generate actionable buy/sell strength ratings.
Key Features:
Price Action Detection: Identifies higher highs/lows (uptrend) and lower highs/lows (downtrend).
MA Crossover Momentum: Monitors 50/200 moving average crossovers to detect trend shifts.
Volume Surge Analysis: Confirms breakouts or pullbacks with significant volume spikes.
Swing Structure Tracking: Maps internal/external breaks to align with Smart Money Concepts.
Indicator Confluence: Aggregates signals from RSI, MACD, ATR, and OBV for precision confirmation.
Multi-Timeframe Alignment: Compares trends across 15m, 1H, 4H, and Daily charts for stacked or conflicting signals.
Strength Levels: Signals range from SELL, STRONG SELL, ULTRA STRONG SELL to BUY, STRONG BUY, ULTRA STRONG BUY.
Dynamic Table Display: Updates every 5 minutes or when overall action changes, showing per-timeframe analysis and the aggregated decision.
Ideal for swing traders, scalpers, and intraday momentum players who want high-confidence trade direction filtered through multiple technical layers.

MARibbonMARibbon インジケーターについて
この「MARibbon」は、3本の移動平均線(MA1、MA2、MA3)を描画し、特にMA2とMA3の関係性に注目して、背景色でトレンドの強弱や転換のサインを視覚的に分かりやすく表示するインジケーターです。
主な特徴
3種類の移動平均線を表示可能
MA1(白色、期間40、太さ2)
MA2(水色、期間200、太さ4)
MA3(ピンク色、期間800、太さ4)
各MAの期間・種類(SMA、EMA、WMA、RMA)・タイムフレームは自由に設定可能。
MA2とMA3の関係性に応じて、チャート背景に色付きのリボン(帯)を表示。
背景リボンの意味
MA2 > MA3(ゴールデンクロス状況)
→ 背景を薄い緑色にして、上昇トレンドの可能性を示唆。
MA3 > MA2(デッドクロス状況)
→ 背景を薄い赤色にして、下降トレンドの可能性を示唆。
それ以外(等しい場合など)は背景色なし(透明)で表示。
入力可能な設定
各移動平均線の期間
各移動平均線の種類(SMA、EMA、WMA、RMA)
各移動平均線のタイムフレーム(デフォルトはチャートと同じ)
使い方
任意の銘柄・時間足のチャートにインジケーターを適用。
必要に応じて、3本の移動平均の期間・種類・時間足を調整。
MA2とMA3の位置関係によって、チャート背景の色が変わり、トレンドの強弱を直感的に把握可能。
MARibbon is a custom indicator that plots three moving averages (MA1, MA2, MA3) and visually fills the space between MA2 and MA3 with color bands to indicate trend strength and direction.
Each MA supports custom type (SMA / EMA / WMA / RMA), length, and timeframe.
A green band appears when MA2 is above MA3.
A red band appears when MA3 is above MA2.
This clean and minimal design helps traders easily visualize overlapping trends and potential crossovers.
💡 Use Cases:
Visually confirm confluence of long- and short-term trends
Identify ribbon-like zones of trend strength
Support for MA cross strategy analysis

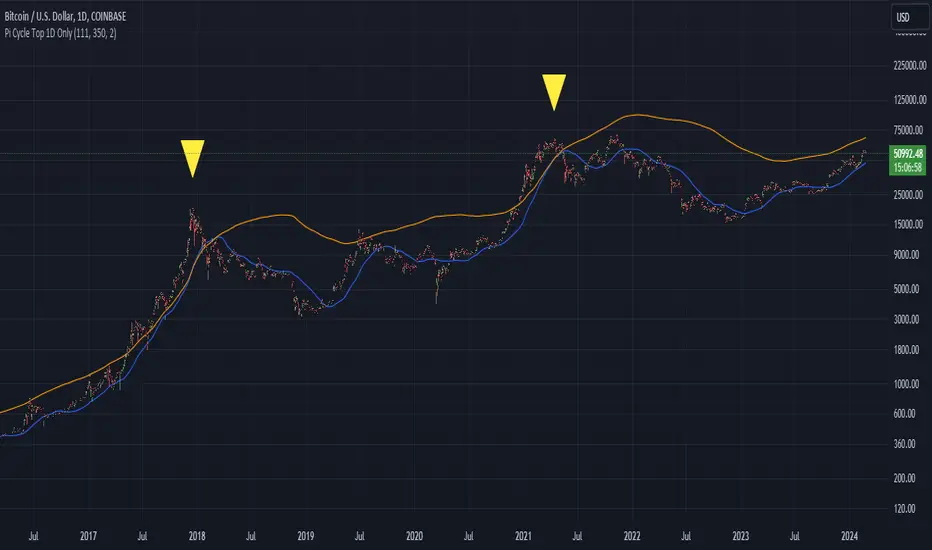
Bitcoin Pi Cycle Top Indicator - Daily Timeframe Only1 Day Timeframe Only
The Bitcoin Pi Cycle Top Indicator has garnered attention for its historical effectiveness in identifying the timing of Bitcoin's market cycle peaks with remarkable precision, typically within a margin of 3 days.
It utilizes a specific combination of moving averages—the 111-day moving average and a 2x multiple of the 350-day moving average—to signal potential tops in the Bitcoin market.
The 111-day moving average (MA): This shorter-term MA is chosen to reflect more recent price action and trends within the Bitcoin market.
The 350-day moving average (MA) multiplied by 2: This longer-term MA is adjusted to capture broader market trends and cycles over an extended period.
The key premise behind the Bitcoin Pi Cycle Top Indicator is that a potential market top for Bitcoin can be signaled when the 111-day MA crosses above the 350-day MA (which has been doubled). Historically, this crossover event has shown a remarkable correlation with the peaks of Bitcoin's price cycles, making it a tool of interest for traders and investors aiming to anticipate significant market shifts.
#Bitcoin
Actieve Inversiones EMABBOL by EDOHEN
EMABBOL includes these indicators:
- triple emas (9,21,50)
- Bollinger Bands
- Also includes buying or selling signals
The following strategy is based on ema crosses and bollinger ma crosses, the Bollinger band gives us the target we could expect from our trades, using the upper and lower bands.
Trading criteria
Buy : Price crosses over the triple emas and also crosses under the Bollinger band ema. Looking for 3:1 PnL
Sell : Price crosses under the triple emas and also crosses under the Bollinger band ema. Looking for 3:1 PnL
Stop Loss Tips : set the SL above the crosses if Selling, below the crosses if buying
Take Profit Tips : set the TP below the Bollinger's lower Band band if Selling, or above the Bollinger's upper Band band if Buying

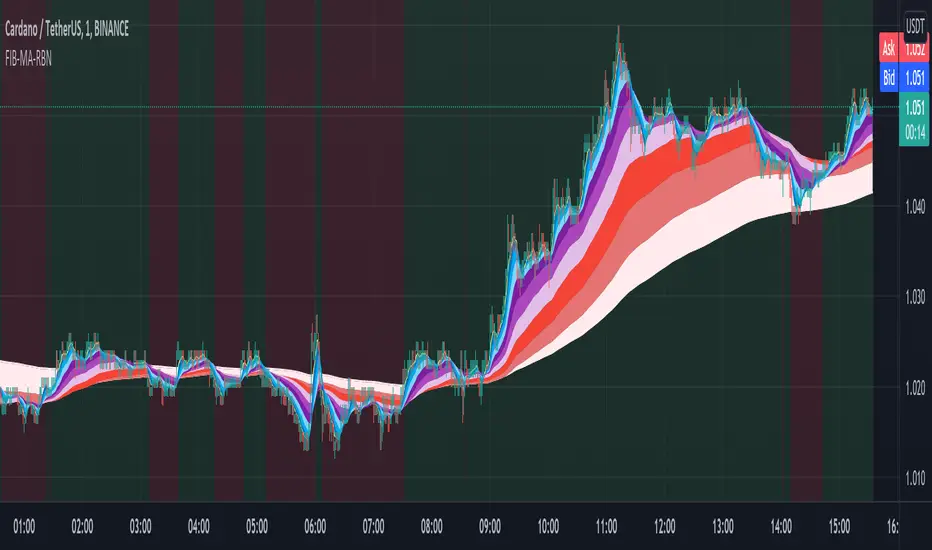
Fibonacci Muti-MA RibbonWelcome some, welcome small.... This is CryptoFilio, your dark knight in the crypto light - shining down my infinite wisdom upon this wasteland we call the "markets". It's me and you against the machine... so rage, rage, rage against the dying of the night!
DESCRIPTION
This indicator exemplifies the beauty of the sacred Fibonacci sequence.... used by flowers and seashells and the intrepid day trader. Each color in the ribbon represents an MA of a specific FIB lookback period. This naturally makes the ribbon front weighted, giving recent price action greater importance than older price action. The undulating curls of the ribbon allow a trader to see key convergences and divergences. The ribbon often narrows before a major price movement.
The background is lightly colored to indicate when one average of MA's crosses the other average (1+2+3+4+5) crosses (6+7+8+9+10). Like a standard MA cross, but a little more sophisticated.
The most visually pleasing is SMMA-RMA, but the more effective in anticipating the market is EMA and HMA.
USAGE
Visualizing convergence and divergence as the ribbon widens with sudden price movement and narrows during consolidation
Visualizing general trends as the flipping over of the ribbon represents a general trend change
Setting possible entry and exit points through the width and direction of the ribbon
VARIATIONS
You can select many types of MA's, such as SMA,EMA,HMA,VWMA... and a couple of others. The most effective seem to be EMA,HMA, and VWMA
SUGGESTIONS
Let me know if you'd like some other features added to this indicator, such as additional MA's or something else. I can also customize it for a specific application.
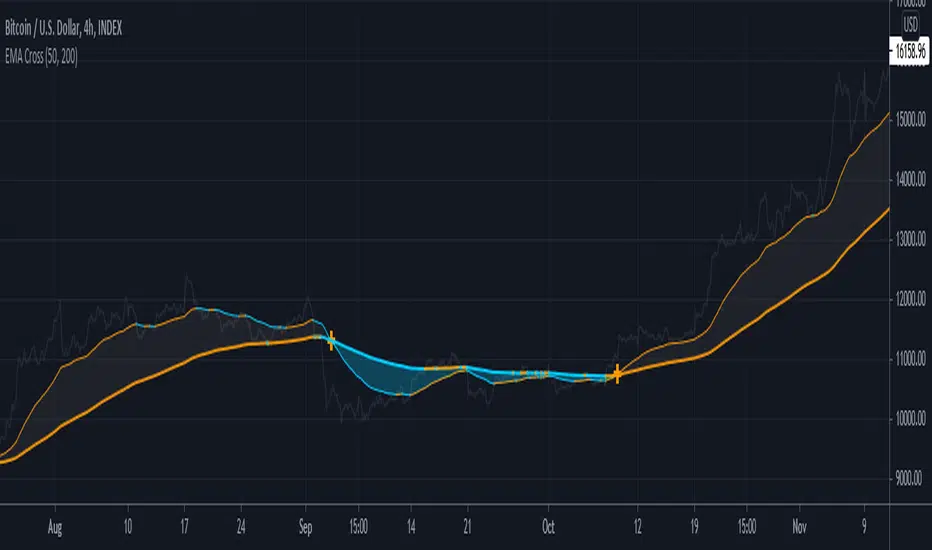
EMA CrossColor coded Fast & Slow Moving Averages. Cross printed at MA cross. MA color changes when price moves above / below MA.
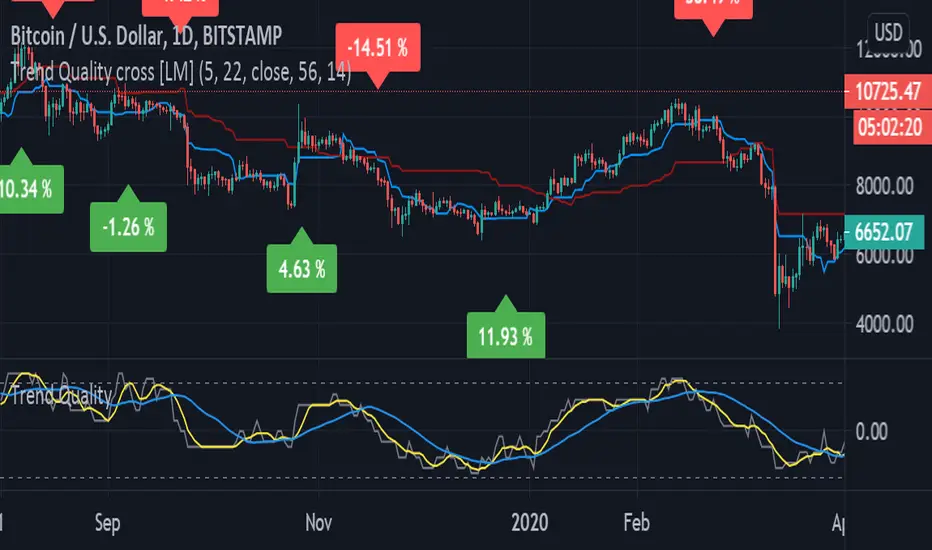
Trend Quality cross [LM]Hi Guys,
I would like to introduce you Trend quality cross indicator. The idea orginallybcomes from @kruskakli and his indicator "Trend Quality" so shout-out to him
I have modified the indicator to display just binary option buy/sell and display diff percentage from previous cross. Also there is a difference that I have double smoothed tq indicator results to give less false signals.
and also added for the same reason like in my other indicator vpci ma cross base line and conversion line from ichimoku.
Any suggestions are welcomed
Point and Figure (PnF) Moving AveragesThis is live and non-repainting Point and Figure Chart Moving Averages tool. The script has it’s own P&F engine and not using integrated function of Trading View.
Point and Figure method is over 150 years old. It consist of columns that represent filtered price movements. Time is not a factor on P&F chart but as you can see with this script P&F chart created on time chart.
P&F chart provide several advantages, some of them are filtering insignificant price movements and noise, focusing on important price movements and making support/resistance levels much easier to identify.
Moving averages on Point & Figure charts are based on the average price of each column while bar chart moving averages are based closing price. Average Price means (ClosePrice + OpenPrice) / 2.
Because of there is double smoothing, you should use shorter lengths for moving averages. Double smoothing means: using average price smooths once, using length greater than 2 smooths price second time.
If you are new to Point & Figure Chart then you better get some information about it before using this tool. There are very good web sites and books. Please PM me if you need help about resources.
Options in the Script
Box size is one of the most important part of Point and Figure Charting. Chart price movement sensitivity is determined by the Point and Figure scale. Large box sizes see little movement across a specific price region, small box sizes see greater price movement on P&F chart. There are four different box scaling with this tool: Traditional, Percentage, Dynamic (ATR), or User-Defined
4 different methods for Box size can be used in this tool.
User Defined: The box size is set by user. A larger box size will result in more filtered price movements and fewer reversals. A smaller box size will result in less filtered price movements and more reversals.
ATR: Box size is dynamically calculated by using ATR, default period is 20.
Percentage: uses box sizes that are a fixed percentage of the stock's price. If percentage is 1 and stock’s price is $100 then box size will be $1
Traditional: uses a predefined table of price ranges to determine what the box size should be.
Price Range Box Size
Under 0.25 0.0625
0.25 to 1.00 0.125
1.00 to 5.00 0.25
5.00 to 20.00 0.50
20.00 to 100 1.0
100 to 200 2.0
200 to 500 4.0
500 to 1000 5.0
1000 to 25000 50.0
25000 and up 500.0
Default value is “ATR”, you may use one of these scaling method that suits your trading strategy.
If ATR or Percentage is chosen then there is rounding algorithm according to mintick value of the security. For example if mintick value is 0.001 and box size (ATR/Percentage) is 0.00124 then box size becomes 0.001.
And also while using dynamic box size (ATR or Percentage), box size changes only when closing price changed.
Reversal : It is the number of boxes required to change from a column of Xs to a column of Os or from a column of Os to a column of Xs. Default value is 3 (most used). For example if you choose reversal = 2 then you get the chart similar to Renko chart.
Source: Closing price or High-Low prices can be chosen as data source for P&F charting.
Options for P&F Moving Averages:
Moving averages on P&F charts are based on the average price of each column. Bar chart moving averages are based on each close price. While 10-day SMA on a bar chart is the average of the last ten closing prices, on a P&F chart, a 10-period SMA is the average price of the last 10 column averages. Average price means “(ClosePrice + OpenPrice) / 2”
2 P&F moving averages are shown on the chart.
It can show Exponental Moving Average ( EMA ) or Simple Moving Average ( SMA )
Source: You can choose Close Price or Average Price as source. Default is Average Price.
“Fast Length” and “Slow Length” are lengths for two moving averages. Default values are 1 and 5.
“Fill between MAs” is the option to fill between Moving averages by predefined colors 'Lime/Blue', 'Lime/Red', 'Green/Red', 'Green/Blue', 'Blue/Red'
There are alerts when Fast MA crossover or crossunder Slow MA. While adding alert “Once Per Bar Close” option should be chosen.

MA + EMA Crossover EMA and MA crossovers are good signals fo trend reversal
You can look at my other scripts.
www.tradingview.com
If you want to ask something, you can message me.

Domino EffectThis illustrates the domino effect of crossing emas to establish changes in Trend State.
Each Ma has been colour coded to show when its increasing vs decreasing or stagnate
Watch and count the FAST MA crosses over the slow MA crosses to recognise changes in trend

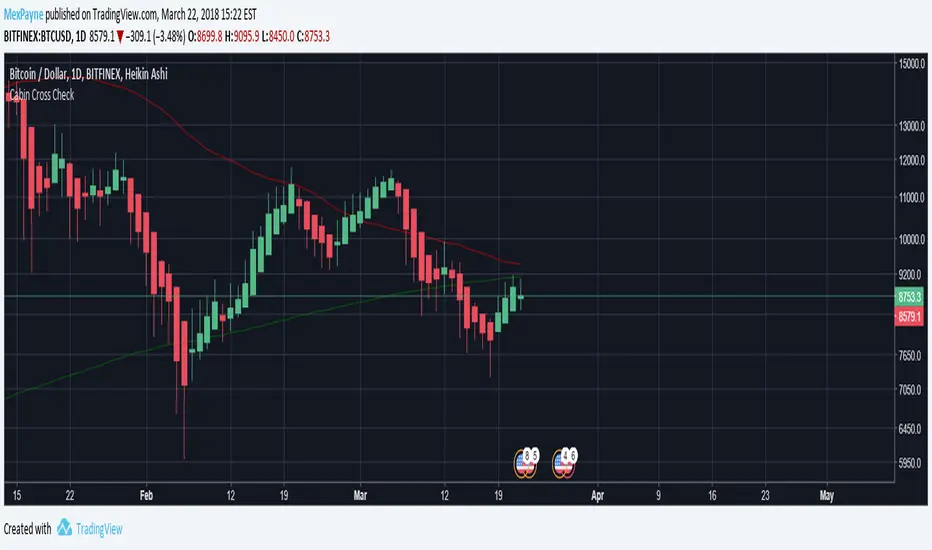
Death Cross - 200 MA / 50 Cross CheckerBITFINEX:BTCUSD
You can check if 200 day MA crossed by 50 day MA. Nuff said.
Multiple Moving AverageSuper simple script integrating three moving averages within only one script. It's going to help you to keep your chart cleaner while saving two spots for other indicators you may like. Try it out and let me know what you think.
A possible trading strategy:
Buy/Sell crossover of the MAs. Buy/Sell when fast MA crosses medium MA, double down when medium MA crosses slow MA.
Combining trading strategy is always a good idea.
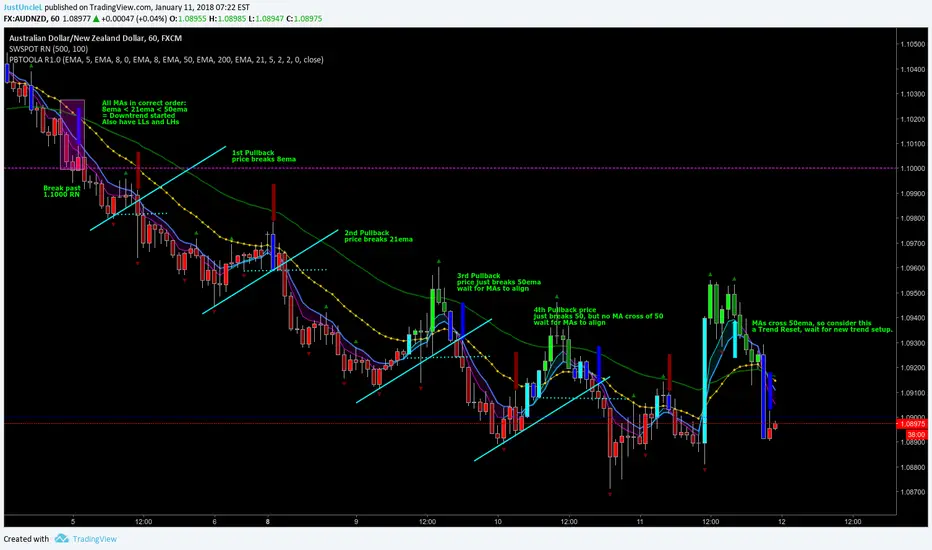
Pullback Trading Tool ALT R1.0 by JustUncleLThis study is an alternative Pullback Tool to my previous versions "Pullback Trading Tool R#.# by JustUncleL". This version aims to provide a cleaner but powerful trading tool. It incorporates the majority of the indicators needed to analyse trade Trends for Pullbacks and Reversals. You can optionally use Heikin Ashi candle or Renko charts. The notes here are mainly in reference to using standard Candlestick 60min signal chart (or Anchor chart time frame), other higher time frames can be used instead as Anchor Time Frames such as 240min(4hr) or 1440min(Daily).
NOTE: A Pullback is synomous to Retracement, generally a Pullback refers to a large Retracement of 100pips or more. In the context of this Tool and any comments related to it, a Pullback will be the same as a Retracement.
Incorporated within this tool are the following indicators:
1. Three Moving Averages (EMA by default) that can optionally be Anchored to a Higher Time Frame:
DodgerBlue = EMA08 (default)
Green = EMA50 (default)
Gray = EMA200 (default), disabled by default.
2. One Anchored Signal Moving Average line Yellow EMA21 (default).
3. Two Un-Anchored Moving Averages as Ribbon, can be disabled.
Aqua = EMA03 (default)
Fuchsia = EMA08 (default)
4. Display Pivots and optional Pivot Levels. By default Pivot is set to : 2 candles RHS of Pivot and 2 candles LHS of Pivot; this is the setting required to show standard Fractal points.
5. Optional HH, LH, LL, HL finder to help with drawing Trend lines and mini Trend Lines.
6. Coloured coded Bar based on the signal MA:
the Standard candle colours:
Blue = candle open and closed above signal MA.
Red = candle open and closed below signal MA.
Yellow = Candle stradle across signal MA.
the Grab candles scheme:
Lime = Bull candle open and closed above signal MA.
Green = Bear candle open and closed above signal MA.
Red = Bull candle open and closed below signal MA.
DarkRed = Bear candle open and closed below signal MA.
Aqua = Bull candle closed across signal MA.
Blue = Bear candle stradle across signal MA.
7. Alert entry arrows generated within a Trend or at the start of a new trend.
An Uptrend is defined as anchored fast (8ema) above anchored signal (21ema) above anchored medium (50ema).
A Downtrend is defined as anchored fast (8ema) below anchored signal (21ema) below anchored medium (50ema).
A Pullback generates an red (short entry) or green (long entry) arrow when price crosses anchored fast or signal MAs and then crosses back to return to trend direction.
A Trend Break, which is defined as any of the MAs crossing breaking trend, generates a blue (short) or aqua (long) arrow and then make new trend (in same or new trend direction).
Smart Money Concepts [XoRonX]# Smart Money Concepts (SMC) - Advanced Trading Indicator
## 📊 Deskripsi
**Smart Money Concepts ** adalah indicator trading komprehensif yang menggabungkan konsep Smart Money Trading dengan berbagai alat teknikal analisis modern. Indicator ini dirancang untuk membantu trader mengidentifikasi pergerakan institusional (smart money), struktur pasar, zona supply/demand, dan berbagai sinyal trading penting.
Indicator ini mengintegrasikan multiple timeframe analysis, order blocks detection, fair value gaps, fibonacci retracement, volume profile, RSI multi-timeframe, dan moving averages dalam satu platform yang powerful dan mudah digunakan.
---
## 🎯 Fitur Utama
### 1. **Smart Money Structure**
- **Internal Structure** - Struktur pasar jangka pendek untuk entry presisi
- **Swing Structure** - Struktur pasar jangka panjang untuk trend analysis
- **BOS (Break of Structure)** - Konfirmasi kelanjutan trend
- **CHoCH (Change of Character)** - Deteksi potensi reversal
### 2. **Order Blocks**
- **Internal Order Blocks** - Zona demand/supply jangka pendek
- **Swing Order Blocks** - Zona demand/supply jangka panjang
- Filter otomatis berdasarkan volatilitas (ATR/Range)
- Mitigation tracking (High/Low atau Close)
- Customizable display (jumlah order blocks yang ditampilkan)
### 3. **Equal Highs & Equal Lows (EQH/EQL)**
- Deteksi otomatis equal highs/lows
- Indikasi liquidity zones
- Threshold adjustment untuk sensitivitas
- Visual lines dan labels
### 4. **Fair Value Gaps (FVG)**
- Multi-timeframe FVG detection
- Auto threshold filtering
- Bullish & Bearish FVG boxes
- Extension control
- Color customization
### 5. **Premium & Discount Zones**
- Premium Zone (75-100% dari range)
- Equilibrium Zone (47.5-52.5% dari range)
- Discount Zone (0-25% dari range)
- Auto-update berdasarkan swing high/low
### 6. **Fibonacci Retracement**
- **Equilibrium to Discount** - Fib dari EQ ke discount zone
- **Equilibrium to Premium** - Fib dari EQ ke premium zone
- **Discount to Premium** - Fib full range
- Reverse option
- Show/hide lines
- Custom colors
### 7. **Volume Profile (VRVP)**
- Visible Range Volume Profile
- Point of Control (POC)
- Value Area (70% volume)
- Auto-adjust rows
- Placement options (Left/Right)
- Width customization
### 8. **RSI Multi-Timeframe**
- Monitor 3 timeframes sekaligus
- Overbought/Oversold signals
- Visual table display
- Color-coded signals (Red OB, Green OS)
- Customizable position & size
### 9. **Moving Averages**
- 3 Moving Average lines
- Pilihan tipe: EMA, SMA, WMA
- Automatic/Manual period mode
- Individual color & width settings
- Cross alerts (MA vs MA, Price vs MA)
### 10. **Multi-Timeframe Levels**
- Support up to 5 different timeframes
- Previous high/low levels
- Custom line styles
- Color customization
### 11. **Candle Color**
- Color candles berdasarkan trend
- Bullish = Green, Bearish = Red
- Optional toggle
---
## 🛠️ Cara Penggunaan
### **A. Setup Awal**
1. **Tambahkan Indicator ke Chart**
- Buka TradingView
- Klik "Indicators" → "My Scripts" atau paste code
- Pilih "Smart Money Concepts "
2. **Pilih Mode Display**
- **Historical**: Tampilkan semua struktur (untuk backtesting)
- **Present**: Hanya tampilkan struktur terbaru (clean chart)
3. **Pilih Style**
- **Colored**: Warna berbeda untuk bullish/bearish
- **Monochrome**: Tema warna abu-abu
---
### **B. Penggunaan Fitur**
#### **1. Smart Money Structure**
**Internal Structure (Real-time):**
- ✅ Aktifkan "Show Internal Structure"
- Pilih tampilan: All, BOS only, atau CHoCH only
- Gunakan untuk entry timing presisi
- Filter confluence untuk mengurangi noise
**Swing Structure:**
- ✅ Aktifkan "Show Swing Structure"
- Pilih tampilan struktur bullish/bearish
- Adjust "Swings Length" (default: 50)
- Gunakan untuk konfirmasi trend utama
**Tips:**
- BOS = Konfirmasi trend continuation
- CHoCH = Warning untuk possible reversal
- Tunggu price retest ke order block setelah BOS
---
#### **2. Order Blocks**
**Setup:**
- ✅ Aktifkan Internal/Swing Order Blocks
- Set jumlah blocks yang ditampil (1-20)
- Pilih filter: ATR atau Cumulative Mean Range
- Pilih mitigation: Close atau High/Low
**Cara Trading:**
1. Tunggu BOS/CHoCH terbentuk
2. Identifikasi order block terdekat
3. Wait for price pullback ke order block
4. Entry saat price respek order block (rejection)
5. Stop loss di bawah/atas order block
6. Target: swing high/low berikutnya
**Color Code:**
- 🔵 Light Blue = Internal Bullish OB
- 🔴 Light Red = Internal Bearish OB
- 🔵 Dark Blue = Swing Bullish OB
- 🔴 Dark Red = Swing Bearish OB
---
#### **3. Equal Highs/Lows (EQH/EQL)**
**Setup:**
- ✅ Aktifkan "Equal High/Low"
- Set "Bars Confirmation" (default: 3)
- Adjust threshold (0-0.5, default: 0.1)
**Interpretasi:**
- EQH = Liquidity di atas, kemungkinan sweep lalu dump
- EQL = Liquidity di bawah, kemungkinan sweep lalu pump
- Biasanya smart money akan grab liquidity sebelum move besar
**Trading Strategy:**
- Wait for EQH/EQL formation
- Anticipate liquidity grab
- Entry setelah sweep dengan konfirmasi (order block, FVG, CHoCH)
---
#### **4. Fair Value Gaps (FVG)**
**Setup:**
- ✅ Aktifkan "Fair Value Gaps"
- Pilih timeframe (default: chart timeframe)
- Enable/disable auto threshold
- Set extension bars
**Cara Trading:**
1. Bullish FVG = Support zone untuk buy
2. Bearish FVG = Resistance zone untuk sell
3. Price tends to fill FVG (retest)
4. Entry saat price kembali ke FVG
5. Partial fill = valid, full fill = invalidated
**Tips:**
- FVG + Order Block = High probability setup
- Multi-timeframe FVG lebih kuat
- Unfilled FVG = strong momentum
---
#### **5. Premium & Discount Zones**
**Setup:**
- ✅ Aktifkan "Premium/Discount Zones"
- Zones akan auto-update berdasarkan swing high/low
**Interpretasi:**
- 🟢 **Discount Zone** = Area BUY (price murah)
- ⚪ **Equilibrium** = Neutral (50%)
- 🔴 **Premium Zone** = Area SELL (price mahal)
**Trading Strategy:**
- BUY dari discount zone
- SELL dari premium zone
- Avoid trading di equilibrium
- Combine dengan structure confirmation
---
#### **6. Fibonacci Retracement**
**Setup:**
- Pilih Fib yang ingin ditampilkan:
- Equilibrium to Discount
- Equilibrium to Premium
- Discount to Premium
- Toggle show lines
- Enable reverse jika perlu
- Custom colors
**Key Levels:**
- 0.236 = Shallow retracement
- 0.382 = Common retracement
- 0.5 = 50% golden level
- 0.618 = Golden ratio (penting!)
- 0.786 = Deep retracement
**Cara Pakai:**
- 0.618-0.786 = Ideal entry zone dalam trend
- Combine dengan order blocks
- Wait for confirmation candle
---
#### **7. Volume Profile (VRVP)**
**Setup:**
- ✅ Aktifkan "Show Volume Profile"
- Set jumlah rows (10-100)
- Adjust width (5-50%)
- Pilih placement (Left/Right)
- Enable POC dan Value Area
**Interpretasi:**
- **POC (Point of Control)** = Harga dengan volume tertinggi = magnet
- **Value Area** = 70% volume = fair price range
- **Low Volume Nodes** = Weak support/resistance
- **High Volume Nodes** = Strong support/resistance
**Trading:**
- POC acts as support/resistance
- Price tends to return to POC
- Breakout dari Value Area = momentum
---
#### **8. RSI Multi-Timeframe**
**Setup:**
- ✅ Aktifkan "Show RSI Table"
- Set 3 timeframes (default: chart, 5m, 15m)
- Set RSI period (default: 14)
- Set Overbought level (default: 70)
- Set Oversold level (default: 30)
- Pilih posisi & ukuran table
**Interpretasi:**
- 🟢 **OS (Oversold)** = RSI ≤ 30 = Kondisi jenuh jual
- 🔴 **OB (Overbought)** = RSI ≥ 70 = Kondisi jenuh beli
- **-** = Neutral zone
**Trading Strategy:**
1. Multi-timeframe alignment = strong signal
2. OS + Bullish structure = BUY signal
3. OB + Bearish structure = SELL signal
4. Divergence RSI vs Price = reversal warning
**Contoh:**
- TF1: OS, TF2: OS, TF3: OS + Price di discount zone = STRONG BUY
---
#### **9. Moving Averages**
**Setup:**
- Pilih MA Type: EMA, SMA, atau WMA (berlaku untuk ketiga MA)
- Pilih Period Mode: Automatic atau Manual
- Set period untuk MA 1, 2, 3 (default: 20, 50, 100)
- Custom color & width per MA
- ✅ Enable Cross Alerts
**Interpretasi:**
- **Golden Cross** = MA fast cross above MA slow = Bullish
- **Death Cross** = MA fast cross below MA slow = Bearish
- Price above all MAs = Strong uptrend
- Price below all MAs = Strong downtrend
**Trading Strategy:**
1. MA1 (20) = Short-term trend
2. MA2 (50) = Medium-term trend
3. MA3 (100) = Long-term trend
**Entry Signals:**
- Price bounce dari MA dalam trend = continuation
- MA cross dengan konfirmasi structure = entry
- Multiple MA confluence = strong support/resistance
**Alerts Available:**
- MA1 cross MA2/MA3
- MA2 cross MA3
- Price cross any MA
---
#### **10. Multi-Timeframe Levels**
**Setup:**
- Enable HTF Level 1-5
- Set timeframes (contoh: 5m, 1H, 4H, D, W)
- Pilih line style (solid/dashed/dotted)
- Custom colors
**Cara Pakai:**
- Previous high/low dari HTF = strong S/R
- Breakout HTF level = significant move
- Multiple HTF levels confluence = major zone
---
### **C. Trading Setup Combination**
#### **Setup 1: High Probability Buy (Bullish)**
1. ✅ Swing structure: Bullish BOS
2. ✅ Price di Discount Zone
3. ✅ Pullback ke Bullish Order Block
4. ✅ Bullish FVG di bawah
5. ✅ RSI Multi-TF: Oversold
6. ✅ Price bounce dari MA
7. ✅ POC/Value Area support
8. ✅ Fibonacci 0.618-0.786 retracement
**Entry:** Saat price reject dari order block dengan confirmation candle
**Stop Loss:** Below order block
**Target:** Swing high atau premium zone
---
#### **Setup 2: High Probability Sell (Bearish)**
1. ✅ Swing structure: Bearish BOS
2. ✅ Price di Premium Zone
3. ✅ Pullback ke Bearish Order Block
4. ✅ Bearish FVG di atas
5. ✅ RSI Multi-TF: Overbought
6. ✅ Price reject dari MA
7. ✅ POC/Value Area resistance
8. ✅ Fibonacci 0.618-0.786 retracement
**Entry:** Saat price reject dari order block dengan confirmation candle
**Stop Loss:** Above order block
**Target:** Swing low atau discount zone
---
#### **Setup 3: Liquidity Grab (EQH/EQL)**
1. ✅ Identifikasi EQH atau EQL
2. ✅ Wait for liquidity sweep
3. ✅ Konfirmasi dengan CHoCH
4. ✅ Order block terbentuk setelah sweep
5. ✅ Entry saat retest order block
---
### **D. Tips & Best Practices**
**Risk Management:**
- Selalu gunakan stop loss
- Risk 1-2% per trade
- Risk:Reward minimum 1:2
- Jangan over-leverage
**Confluence adalah Kunci:**
- Minimal 3-4 konfirmasi sebelum entry
- Lebih banyak konfirmasi = higher probability
- Quality over quantity
**Timeframe Analysis:**
- HTF (Higher Timeframe) = Trend direction
- LTF (Lower Timeframe) = Entry timing
- Align dengan HTF trend
**Backtesting:**
- Gunakan mode "Historical"
- Test strategy di berbagai market condition
- Record dan analyze hasil
**Market Condition:**
- Trending market = Follow BOS, use order blocks
- Ranging market = Use premium/discount zones, EQH/EQL
- High volatility = Wider stops, wait for clear structure
**Avoid:**
- Trading di equilibrium zone
- Entry tanpa konfirmasi
- Fighting the trend
- Overleveraging
- Emotional trading
---
## 📈 Recommended Settings
### **For Scalping (1m - 5m):**
- Internal Structure: ON
- Swing Structure: OFF
- Order Blocks: Internal only
- RSI Timeframes: 1m, 5m, 15m
- MA Periods: 9, 21, 50
### **For Day Trading (15m - 1H):**
- Internal Structure: ON
- Swing Structure: ON
- Order Blocks: Both
- RSI Timeframes: 15m, 1H, 4H
- MA Periods: 20, 50, 100
### **For Swing Trading (4H - D):**
- Internal Structure: OFF
- Swing Structure: ON
- Order Blocks: Swing only
- RSI Timeframes: 4H, D, W
- MA Periods: 20, 50, 200
---
## ⚠️ Disclaimer
Indicator ini adalah alat bantu analisis teknikal. Tidak ada indicator yang 100% akurat. Selalu:
- Lakukan analisa fundamental
- Gunakan proper risk management
- Praktik di demo account terlebih dahulu
- Trading memiliki resiko, trade at your own risk
---
## 📝 Version Info
**Version:** 5.0
**Platform:** TradingView Pine Script v5
**Author:** XoRonX
**Max Labels:** 500
**Max Lines:** 500
**Max Boxes:** 500
---
## 🔄 Updates & Support
Untuk update, bug reports, atau pertanyaan:
- Check documentation regularly
- Test new features in replay mode
- Backup your settings before updates
---
## 🎓 Learning Resources
**Recommended Study:**
1. Smart Money Concepts (SMC) basics
2. Order blocks theory
3. Liquidity concepts
4. ICT (Inner Circle Trader) concepts
5. Volume profile analysis
6. Multi-timeframe analysis
**Practice:**
- Start with higher timeframes
- Master one concept at a time
- Keep a trading journal
- Review your trades weekly
---
**Happy Trading! 🚀📊**
_Remember: The best indicator is your own analysis and discipline._

7/21 EMA ADX Pro After many months (actually years) of intense research, countless hours of testing different approaches, and rigorous backtesting, I’ve finally developed this indicator/strategy based on moving average crossovers enhanced with power-based filtering to significantly reduce false signals and whipsaws. This is not just another basic MA crossover system. The core idea revolves around applying mathematical powers (exponents) to the moving averages and combining them with additional confirmation filters, creating a much more robust and reliable signal generation mechanism. I’m sharing it with the community in the hope that it can be useful to someone else who, like me, has spent endless nights trying to find an edge in the markets. Feel free to test it, modify it, or improve it. Feedback, suggestions, and constructive criticism are always welcome. If you find it helpful, a simple like or comment would mean a lot — it’s the result of a huge amount of work and passion. Happy trading! (Full Pine Script code will be posted below or in the next update — stay tuned!
